 utoo-lint
Benchmark results
The homepage chart uses the archived run recorded on August 30, 2026. It is not a measurement of the latest release. Use these numbers to understand this workload, then benchmark your own project before drawing broader conclusions.
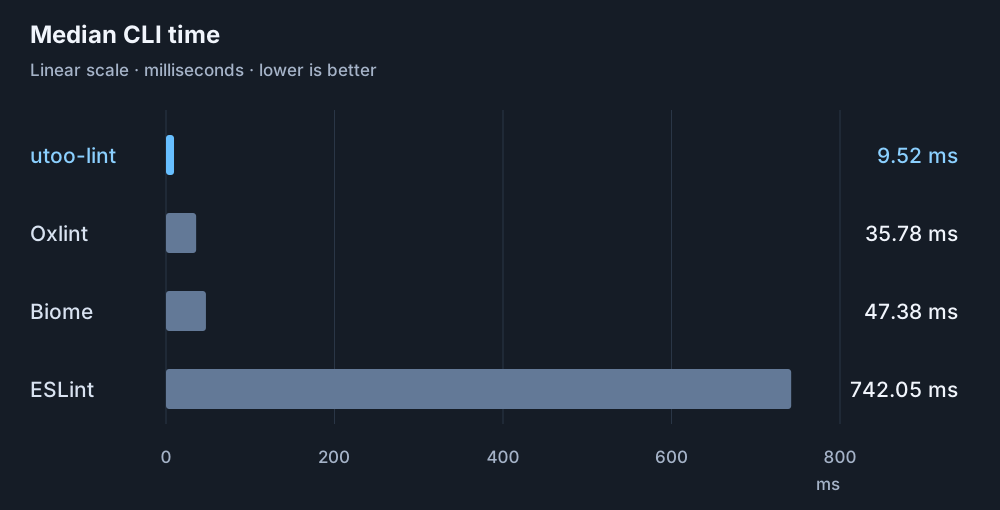
| Tool | Median wall-clock time |
|---|---|
| utoo-lint | 9.52 ms |
| Oxlint | 35.78 ms |
| Biome | 47.38 ms |
| ESLint | 742.05 ms |
The image uses a linear scale starting at zero. The table rounds the original measurements to two decimal places; the downloadable data retains all samples.
What was measured
- Corpus: 100 generated TypeScript files, with no intentional diagnostics.
- Rules: the same 12 shared rules for every tool.
- Sampling: 5 warmups, followed by 20 measured runs per tool.
- Runtime: macOS arm64, Node.js 20.19.1.
- Timing: wall-clock time for a fresh CLI process, including startup.
The snapshot records the commands and every timing sample. It does not record CPU model or the exact linter versions, so it cannot support version-specific or hardware-independent claims. Daemon reuse, caches, editor integrations, and ESLint rules requiring type information are outside this comparison.
Inspect or reproduce
Download the complete measurement snapshot. The benchmark suite contains the corpus generator, shared-rule mapping, and runner. From a checkout with the development prerequisites installed:
zig build -Doptimize=fastpnpm --dir benchmarks installpnpm bench:generate -- --files=100pnpm bench -- --runs=20 --warmups=5
This produces a new measurement using your local binary and installed tool versions; it will not reproduce the archived times exactly. Compare tools using the same machine, corpus, and rule set.